
How long does it take different age groups to find employment after being made redundant?
Do older workers languish in unemployment longer than younger workers after redundancy? Or are employers keen to snap up experienced workers fresh out of work? We’ve analysed the data.
The 2006 analysis: evidence of age discrimination?
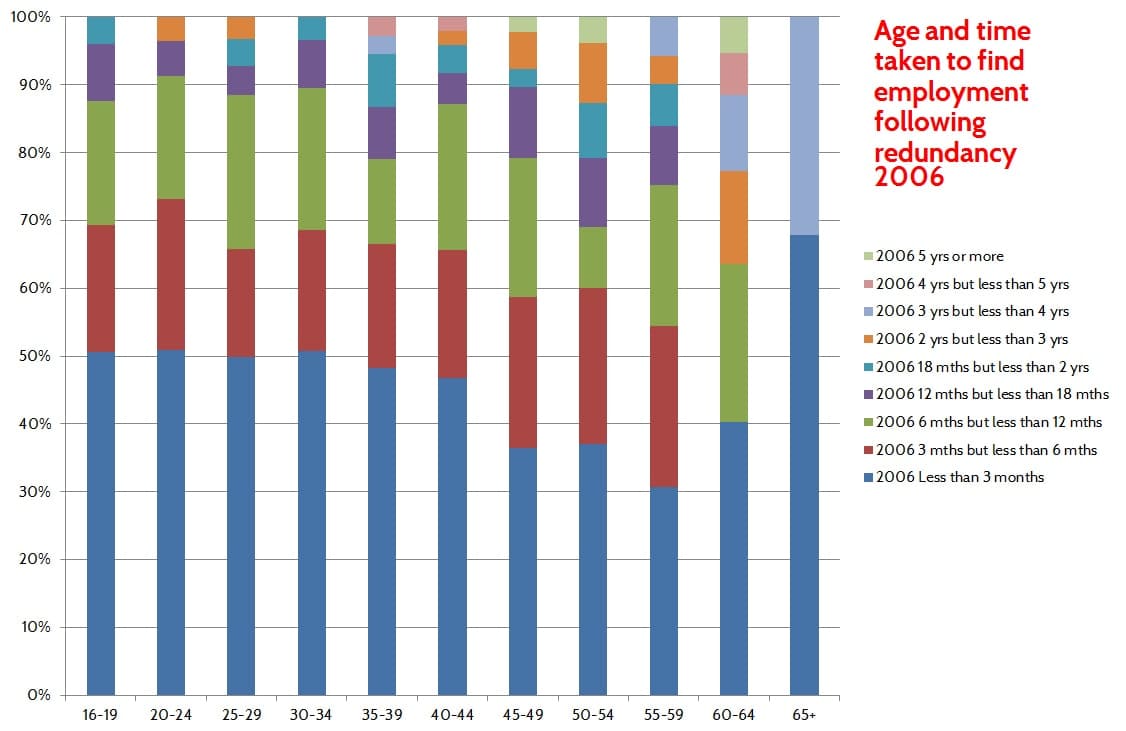
The 2006 analysis shows considerable difference between the length of time it take various age groups to find employment. There is a downwards trend as you progress up the age groups. For example, less than half of those aged 16-19 take more than 3 months to find a new job, compared with nearly 7 out of 10 of those aged 55-59.
Old people are more likely to spend longer unemployed than younger people. Arguably, this is evidence of age discrimination in recruitment and selection.
The 2009 analysis: no age discrimination
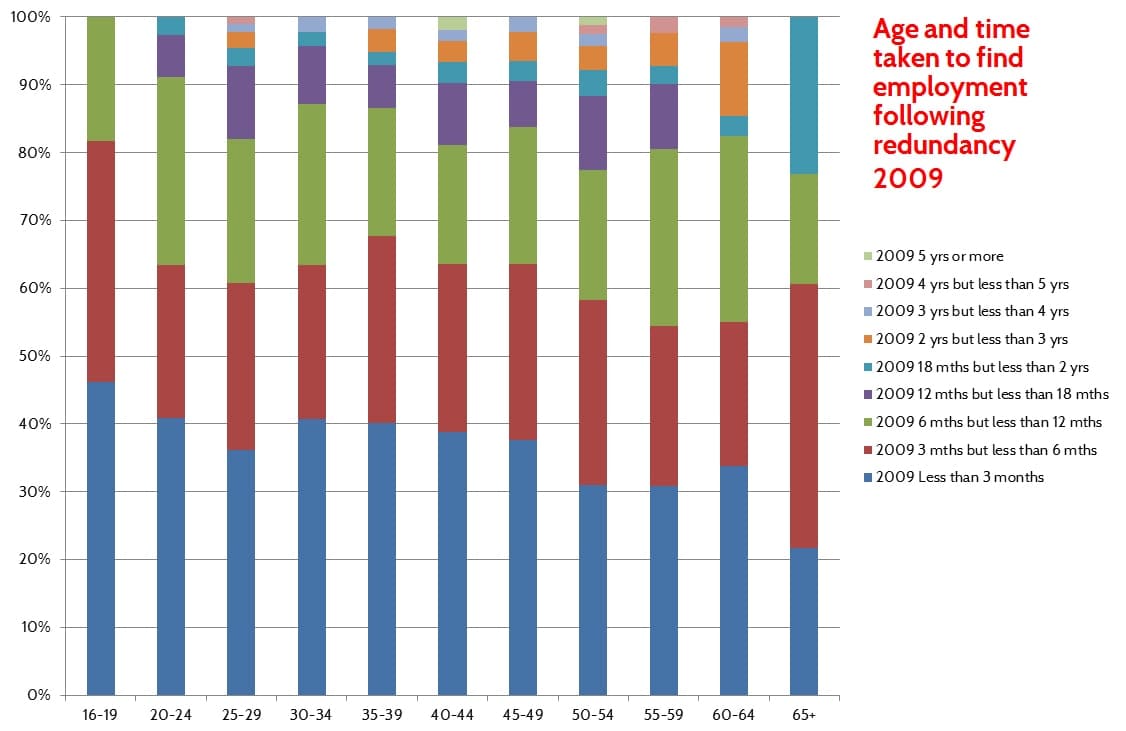
Compared with 2006, there is more uniformity of treatment. There is still some variation amongst the age groups, but this is much less pronounced. Those aged 20-64 all took a broadly similar amount of time to find new employment.
The 2012 analysis: increasingly unequal treatment

All age groups are spending longer unemployed. Excluding the extremes of ages, little more than 50% of people find employment within 6 months.
The downward trend that can be seen in the 2006 graph is back. Each five year age group tends to be more likely to spend longer unemployed than the one before. Age is again a predictor of the time taken to find new work following redundancy.
Those aged 30-34 tend to spend a bit less time unemployed than the trend would otherwise suggest. Whilst compared to other age groups, those 40-44 years old spend longer unemployed. Less than 20% of this age group find work within 3 months – the lowest of all age groups.
Another thing to note is that the older age groups were more likely to be out of work for longer following redundancy in 2012 than they were in either 2006 or 2009.
The 2015 analysis

This graph is very different to those in previous years due to a change in the way the ONS collect their data. The variable REDYL11 has been replaced with REDYL13, which separates redundancy into voluntary and non-voluntary categories.
Many of the data points were empty as they contained too few individuals to be reliable.