
How are the demographics of the workforce changing? Are the new jobs being taken by older or younger workers?

Number of over 65 year olds in employment (UK)
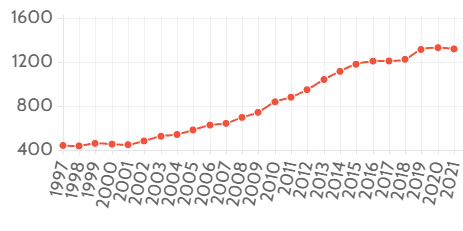
- Number of over 65s in employment (000s)
This had been increasing by an average of around 10,000 people each a month, but now has plateaued. The rise in over 65s in employment began at the turn of the century, but increased after the abolition of the Default Retirement Age.
Source: ONS
Number of over 50s in employment (UK)
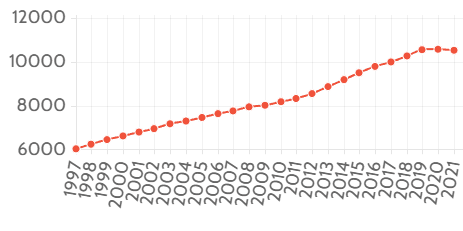
- 000s
This chart shows in 000s the number of over 50s in employment in the UK during April-June in each year listed. It surpassed 10m during November 2017.
Number of 50-64 year olds in employment (UK)
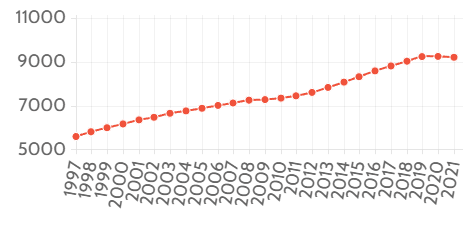
- 000s
This chart shows in 000s the number of 50-64 year olds in employment in the UK.
Economic activity by age group (UK)
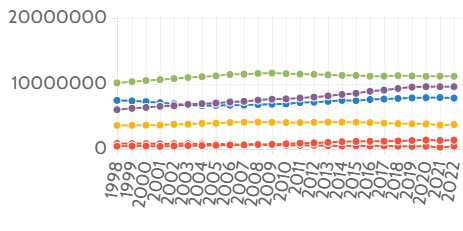
- 16-17
- 18-24
- 25-34
- 35-49
- 50-64
- 65+
Those aged 50-64 outnumber those aged 25-34. The number of active 16-17 years has nearly halved. The number of active 65+ has more than doubled.
UK Life expectancy (from birth, 1841-2011)
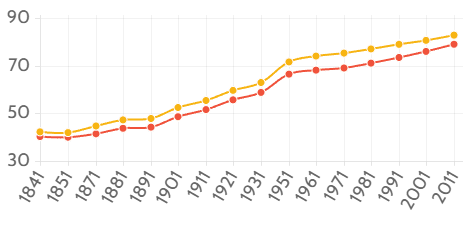
- Male
- Female
In 1841 the average newborn boy was not expected to live much beyond their 40th birthday. Today, newborn boys should reach their 79th birthday (with girls living well into their 80s).
Actual pension age vs hypothetical pension age (1981-2027)
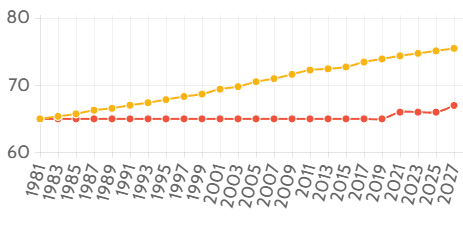
- pension age
- hypothetical pension age
The state pension age has remained at 65 (for men, 60 for women) for many years. Over the next decade it will start to increase slowly and will be linked to life expectancy when it reaches 67 in 2027.
Further reading on demographic issues can be found on our sister site: www.futureofworkhub.info/demographics